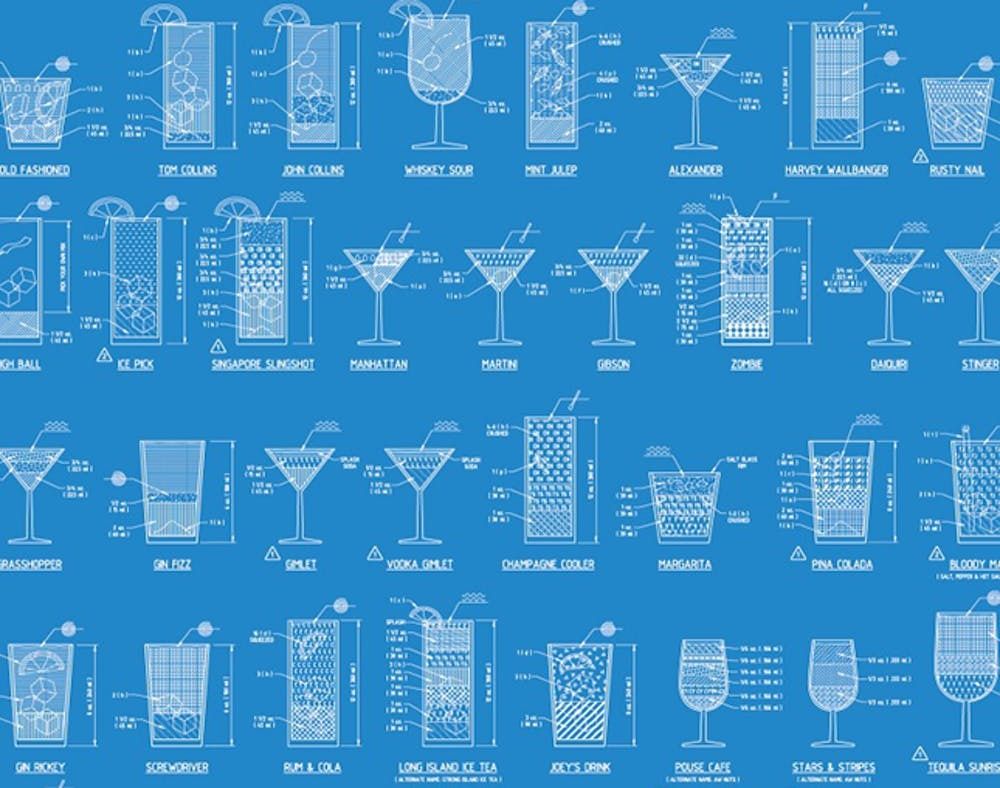
Cocktails are an art — an art we at Brit + Co can certainly appreciate. But while you may consider yourself a part-time mixologist, you might not see your next Tom Collins the way, say, your engineer bud might. To each her own, and what we see as yummy, crafty drinks, an engineer, like the one behind this nifty infographic, just might see those sippers as schematics of formulas to creating more than 70 cocktails.
Shaan Hurley gave us a peek at what happy hour looks like in the engineer’s mind with this boozy breakdown that we definitely want to print, frame and hang above our bar cart. It even comes in a blueprint version.
This schematic doesn’t just give you an ounce-by-ounce breakdown for each of the cocktails. It tells you what kind glass it should be served in and, of course, if it’s best shaken or stirred. With this great cheat sheet, we think it’s time we brush up on our bartending skills and host the most epic cocktail party EVER.
Infographics are one of our favorite ways to take in information, but this is one of the first we’ve seen created in AutoCAD. The design program is usually used for, you know, highly detailed engineering and architecture projects. Turns out, it’s great for making a cocktail guide, too! We love the fun patterns, all unique to the 42 kinds of liquids + the icons for the garnishes.
Shaan encourages people to download the PDF from his site and hang it up in your home or local watering hole. If you do that, it’d be awesome to show him some love for the design with a donation. Think of it like… buying him a well-earned drink ;)
What’s your favorite cocktail of the bunch? What’s a new one that you want to try? Let us know in the comments!
